RStudio Conference 2019 takes place in January 2019, and this week RStudio put out a call for contributed talks and e-posters. Though I was eager to browse previous years’ abstracts for inspiration, I couldn’t find them all in one place, and so I decided to use one of my favourite R packages, rvest, to do some web scraping to grab the content.
My main aim was to find all of the abstracts for the contributed talks only from 2018.
As this ended up being an unusually long blog post, here’s a table containing links to the videos and abstract for contributed talks. A detailed walk through of the code used to create it can be found below.
As ever, give me a shout on Twitter if you have any comments or questions!
| talks | authors | titles | links |
|---|---|---|---|
| The future of time series and financial analysis in the tidyverse | Davis Vaughan | The future of time series and financial analysis in the tidyverse | https://www.rstudio.com/resources/videos/the-future-of-time-series-and-financial-analysis-in-the-tidyverse/ |
| infer: a package for tidy statistical inference | Andrew Bray | infer: a package for tidy statistical inference | http://www.rstudio.com/resources/videos/infer-a-package-for-tidy-statistical-inference/ |
| Tidying up your network analysis with tidygraph and ggraph | Thomas Lin Pedersen | Tidying up your network analysis with tidygraph and ggraph | https://www.rstudio.com/resources/videos/tidying-up-your-network-analysis-with-tidygraph-and-ggraph/ |
| The lesser known stars of the tidyverse | Emily Robinson | The lesser known stars of the tidyverse | https://www.rstudio.com/resources/videos/the-lesser-known-stars-of-the-tidyverse/ |
| Creating interactive web graphics suitable for exploratory data analysis | Carson Sievert | Creating interactive web graphics suitable for exploratory data analysis | https://www.rstudio.com/resources/videos/creating-interactive-web-graphics-suitable-for-exploratory-data-analysis/ |
| Open-source solutions for medical marijuana | Carl Ganz | Open-source solutions for medical marijuana | https://www.rstudio.com/resources/videos/open-source-solutions-for-medical-marijuana/ |
| Adaptive feedback for learnr tutorials | Daniel Kaplan | Adaptive feedback for learnr tutorials | https://www.rstudio.com/resources/videos/adaptive-feedback-for-learnr-tutorials/ |
| tidycf: Turning analysis on its head by turning cashflows on their sides | Emily Riederer | tidycf: Turning analysis on its head by turning cashflows on their sides | http://www.rstudio.com/resources/videos/tidycf-turning-analysis-on-its-head-by-turning-cashflows-on-their-sides/ |
| Branding and automating your work with R Markdown | Daniel Hadley | Branding and automating your work with R Markdown | https://www.rstudio.com/resources/videos/branding-and-automating-your-work-with-r-markdown/ |
| Understanding PCA using Shiny and Stack Overflow data | Julia Silge | Understanding PCA using Shiny and Stack Overflow data | https://www.rstudio.com/resources/videos/understanding-pca-using-shiny-and-stack-overflow-data/ |
| Connecting to open source databases | Kirill Muller | Connecting to open source databases | https://www.rstudio.com/resources/videos/connecting-to-open-source-databases/ |
| An assignment operator to unpack vectors and lists | Nathan Teetor | An assignment operator to unpack vectors and lists | https://www.rstudio.com/resources/videos/an-assignment-operator-to-unpack-vectors-and-lists/ |
| Developing and deploying large scale shiny applications | Herman Sontrop | Developing and deploying large scale shiny applications | http://www.rstudio.com/resources/videos/developing-and-deploying-large-scale-shiny-applications/ |
| Five packages in five weeks - from boredom to contribution via blogging | Giora Simchoni | Five packages in five weeks from boredom to contribution via blogging | https://www.rstudio.com/resources/videos/five-packages-in-five-weeks-from-boredom-to-contribution-via-blogging/ |
| A SAS-to-R success story | Elizabeth J. Atkinson | A SAS-to-R success story | https://www.rstudio.com/resources/videos/a-sas-to-r-success-story/ |
| Reinforcement learning in Minecraft with CNTK-R | Ali-Kazim Zaidi | Reinforcement learning in Minecraft with CNTK-R | https://www.rstudio.com/resources/videos/reinforcement-learning-in-minecraft-with-cntk-r/ |
| Kaggle in the classroom: using R and GitHub to run predictive modeling competitions | Colin Rundel | Kaggle in the classroom: using R and GitHub to run predictive modeling competitions | https://www.rstudio.com/resources/videos/kaggle-in-the-classroom-using-r-and-github-to-run-predictive-modeling-competitions/ |
| Imagine Boston 2030: Using R-Shiny to keep ourselves accountable and empower the public | Kayla Patel | Imagine Boston 2030: Using R-Shiny to keep ourselves accountable and empower the public | https://www.rstudio.com/resources/videos/imagine-boston-2030-using-r-shiny-to-keep-ourselves-accountable-and-empower-the-public/ |
| Something old, something new, something borrowed, something blue: Ways to teach data science (and learn it too!) | Chester Ismay | Something old, something new, something borrowed, something blue: Ways to teach data science (and learn it too!) | https://www.rstudio.com/resources/videos/something-old-something-new-something-borrowed-something-blue-ways-to-teach-data-science-and-learn-it-too/ |
| Training an army of new data scientists | Marco Blume | Training an army of new data scientists | https://www.rstudio.com/resources/videos/training-an-army-of-new-data-scientists/ |
Here’s a walkthrough of the code, and the full list of abstracts.
Getting Started
I found last year’s conference schedule [here] (https://beta.rstudioconnect.com/content/3105/), which seemed as good a place as any to start. First, I loaded the rvest package and used read_html() (from xml2 which is automatically loaded when you load rvest) to pull the html from the page.
library(rvest)
my_html <- read_html("https://beta.rstudioconnect.com/content/3105/")
my_html
## {xml_document}
## <html xmlns="http://www.w3.org/1999/xhtml">
## [1] <head>\n<meta charset="utf-8">\n<meta http-equiv="Content-Type" cont ...
## [2] <body>\n\n<style type="text/css">\n.main-container {\n max-width: 9 ...The my_html object is an xml document, and to do anything useful with it, I need to work out which components I need. I could do this manually, but it’s much simpler to use Selector Gadget to help me.
Selector Gadget
Selector Gadget is a tool which takes a lot of effort out of webscraping. For an in-depth description, check out this rvest vignette. In short, once Selector Gadget is loaded, I click on any unselected components to pick which ones I need (in green), look at what else is highlighted (in yellow) and then click on these to deselect them (now in red) and carry on selecting and/or deselecting components until only the ones I want are in green or yellow.
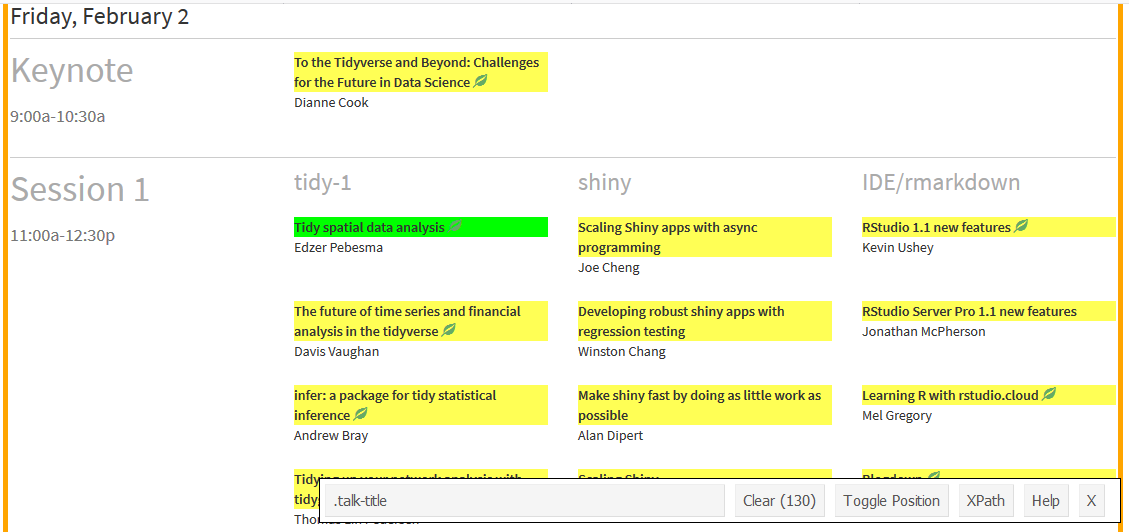
Then, I copy the text out of the box, in the case, “.talk-title”. This is the CSS selector needed to grab those components, and I supply this as the css argument to html_nodes(). As I just want the inner text, I pipe the result of this into html_text().
talks <- my_html %>%
  html_nodes(".talk-title") %>%
  html_text()

head(talks)
## [1] "\nTo the Tidyverse and Beyond: Challenges for the Future in Data Science\n\n"
## [2] "\nTo the Tidyverse and Beyond: Challenges for the Future in Data Science\n\n"
## [3] "\nTidy spatial data analysis\n\n"
## [4] "Scaling Shiny apps with async programming"
## [5] "\nRStudio 1.1 new features\n\n"
## [6] "\nThe future of time series and financial analysis in the tidyverse\n\n"I now repear this process to get the presenter names. Handily, the CSS selector for these is “.presenter”!
authors <- my_html %>%
  html_nodes(".presenter") %>%
  html_text()

head(authors)
## [1] "Dianne Cook" "Dianne Cook" "Edzer Pebesma" "Joe Cheng"
## [5] "Kevin Ushey" "Davis Vaughan"Now I’ve got my talks and authors, I’m next going to combine them in a data_frame. Once this is done, I’m also going to tidy them up by removing all the newline characters (“\n”) from the titles.
library(dplyr)
library(stringr)
schedule <- data_frame(talks, authors) %>%
  mutate(talks = str_remove_all(talks, "\n")) %>%
  distinct()

head(schedule)
## # A tibble: 6 x 2
## talks authors
## <chr> <chr>
## 1 To the Tidyverse and Beyond: Challenges for the Future in D~ Dianne Cook
## 2 Tidy spatial data analysis Edzer Pebe~
## 3 Scaling Shiny apps with async programming Joe Cheng
## 4 RStudio 1.1 new features Kevin Ushey
## 5 The future of time series and financial analysis in the tid~ Davis Vaug~
## 6 Developing robust shiny apps with regression testing Winston Ch~Great! So now what? Well, the point of this analysis is to look at the contributed talks, rather than those from invited speakers or RStudio staff, so in the next part of this post, I’m going to be using lots of dplyr joins to remove these!
Finding Only Contributed Talks
Let’s start of with identifying talks from invited speakers and RStudio staff.
I found this post on the RStudio blog which lists the invited speakers. I repeat the process from earlier using rvest and xml2 functions to scrape the list of invited speakers.
invited_speakers <- read_html("https://blog.rstudio.com/2017/07/12/join-us-at-rstudioconf-2018/") %>%
  html_nodes("table:nth-child(6) td:nth-child(1)") %>%
  html_text()

invited <- data_frame(authors = invited_speakers, Status = "Invited")
head(invited)
## # A tibble: 6 x 2
## authors Status
## <chr> <chr>
## 1 Mara Averick Invited
## 2 Nick Carchedi Invited
## 3 Tanya Cashorali Invited
## 4 Eric Colson Invited
## 5 Sandra Griffith Invited
## 6 Aaron Horowitz InvitedNow I need to combine this back with my original table, schedule, so I use left_join() from dplyr to help me.
author_tbl <- left_join(schedule, invited, by = "authors")
head(author_tbl)
## # A tibble: 6 x 3
## talks authors Status
## <chr> <chr> <chr>
## 1 To the Tidyverse and Beyond: Challenges for the Fut~ Dianne Cook <NA>
## 2 Tidy spatial data analysis Edzer Pebes~ Invit~
## 3 Scaling Shiny apps with async programming Joe Cheng <NA>
## 4 RStudio 1.1 new features Kevin Ushey <NA>
## 5 The future of time series and financial analysis in~ Davis Vaugh~ <NA>
## 6 Developing robust shiny apps with regression testing Winston Cha~ <NA>Something you may have noticed is that we have some duplicated rows in the table, and so I use distinct() to remove these.
author_tbl <- distinct(author_tbl)
head(author_tbl)
## # A tibble: 6 x 3
## talks authors Status
## <chr> <chr> <chr>
## 1 To the Tidyverse and Beyond: Challenges for the Fut~ Dianne Cook <NA>
## 2 Tidy spatial data analysis Edzer Pebes~ Invit~
## 3 Scaling Shiny apps with async programming Joe Cheng <NA>
## 4 RStudio 1.1 new features Kevin Ushey <NA>
## 5 The future of time series and financial analysis in~ Davis Vaugh~ <NA>
## 6 Developing robust shiny apps with regression testing Winston Cha~ <NA>Great! Now I’ve remove the duplications, let’s take a look at how many rows have no value in the Status column. I can use sum() and is.na() to do this
sum(is.na(author_tbl$Status))## [1] 51I still have 51 rows with no value in the Status column, but I’m only expecting around 20. I need to remove talks from RStudio staff to get to my
contributed talks.
I did the next bit manually, by searching for any of the individuals I hadn’t already heard of. It’s likely that there’s a quicker way to do this, using the web scraping techniques we’ve already looked at.
In no particular order…
rstudio_staff <- c("Joe Cheng", "Winston Chang", "Alan Dipert", "Sean Lopp",
                   "Kevin Ushey", "Jonathan McPherson", "Mel Gregory",
                   "Yihui Xie", "Max Kuhn", "Jenny Bryan", "Jim Hester",
                   "Joseph Rickert", "Jeff Allen", "Aron Atkins",
                   "Barbara Borges Ribeiro", "Nathan Stephens",
                   "Mine Cetinkaya-Rundel", "Aaron Berg", "Hadley Wickham",
                   "Edgar Ruiz", "Amanda Gadrow", "JJ Allaire", "Kevin Kuo",
                   "Javier Luraschi", "Michael Quinn", "Tareef Kawaf")

rstudio <- data_frame(authors = rstudio_staff, Status = "RStudio")
head(rstudio)
## # A tibble: 6 x 2
## authors Status
## <chr> <chr>
## 1 Joe Cheng RStudio
## 2 Winston Chang RStudio
## 3 Alan Dipert RStudio
## 4 Sean Lopp RStudio
## 5 Kevin Ushey RStudio
## 6 Jonathan McPherson RStudioOK, so this is where it gets a little complicated, so please bear with me.
What I need to do next is combine my list of RStudio people with the schedule data_frame. However, I can’t just do a left_join:
left_join(author_tbl, rstudio, by = "authors") %>%
  head()
## # A tibble: 6 x 4
## talks authors Status.x Status.y
## <chr> <chr> <chr> <chr>
## 1 To the Tidyverse and Beyond: Challenges fo~ Dianne Co~ <NA> <NA>
## 2 Tidy spatial data analysis Edzer Peb~ Invited <NA>
## 3 Scaling Shiny apps with async programming Joe Cheng <NA> RStudio
## 4 RStudio 1.1 new features Kevin Ush~ <NA> RStudio
## 5 The future of time series and financial an~ Davis Vau~ <NA> <NA>
## 6 Developing robust shiny apps with regressi~ Winston C~ <NA> RStudioOh no! The left join has created 2 new columns, Status.x and Status.y, representing the value of Status in the x and y.
This is because all of the RStudio staff already exist in author_tbl, with a Status value of NA.
Sad times! However, a quick trip to Stack Overflow tells me what I need to do: * Note that more efficient solutions may exist! *
Extract all of the speakers who are not RStudio staff from
author_tblusinganti_join().Join my
rstudiotable with my originalscheduletable which does not have aStatuscolumn, usingleft_join(). As I removed duplicates after this, I’ll have to do it again, usingdistinct().Combine the outputs from 1 and 2, using
bind_rows(). It looks kinda ugly below as I wanted to do it all in a single pipe.
I’ve used tail() to have a peek at the last 6 rows of the data_frame as I expect the rows for all the RStudio staff to be at the bottom of the table.
author_tbl <- anti_join(author_tbl, rstudio, by = "authors") %>%
  bind_rows(
    left_join(rstudio, schedule, by = "authors") %>%
      distinct()
  )

tail(author_tbl)
## # A tibble: 6 x 3
## talks authors Status
## <chr> <chr> <chr>
## 1 Debugging techniques in RStudio Amanda Gadrow RStud~
## 2 Machine Learning with R and TensorFlow JJ Allaire RStud~
## 3 Building Spark ML pipelines with sparklyr Kevin Kuo RStud~
## 4 Deploying TensorFlow models with tfdeploy Javier Luras~ RStud~
## 5 Large scale machine learning using TensorFlow, Big~ Michael Quinn RStud~
## 6 R for Presidents Tareef Kawaf RStud~Hooray!
I skim through the data and realise I probably need to add a Status value for the keynote speakers. JJ Allaire has already been included in RStudio, so it’s just Dianne Cook that I need to add. I use the same technique as before:
keynotes <- data_frame(authors = "Dianne Cook",
                       Status = "keynote")

author_tbl <- anti_join(author_tbl, keynotes, by = "authors") %>%
  bind_rows(
    inner_join(keynotes, schedule, by = "authors") %>%
      distinct()
  )
I have a quick look over the data, and remove the discussions and closing remarks from the data using filter().
author_tbl <- author_tbl %>%
filter(!talks %in% c("R in industry discussion", "Tidyverse discussion", "Closing remarks") )
Finally, I filter() again to only show the rows for which the Status column contains an NA, and drop the now-redundant Status column.
contributed_talks <- filter(author_tbl, is.na(Status)) %>%
  select(-Status)

contributed_talks
## # A tibble: 20 x 2
## talks authors
## <chr> <chr>
## 1 The future of time series and financial analysis in ~ Davis Vaughan
## 2 infer: a package for tidy statistical inference Andrew Bray
## 3 Tidying up your network analysis with tidygraph and ~ Thomas Lin Peder~
## 4 The lesser known stars of the tidyverse Emily Robinson
## 5 Creating interactive web graphics suitable for explo~ Carson Sievert
## 6 Open-source solutions for medical marijuana Carl Ganz
## 7 Adaptive feedback for learnr tutorials Daniel Kaplan
## 8 tidycf: Turning analysis on its head by turning cash~ Emily Riederer
## 9 Branding and automating your work with R Markdown Daniel Hadley
## 10 Understanding PCA using Shiny and Stack Overflow data Julia Silge
## 11 Connecting to open source databases Kirill Müller
## 12 An assignment operator to unpack vectors and lists Nathan Teetor
## 13 Developing and deploying large scale shiny applicati~ Herman Sontrop
## 14 Five packages in five weeks - from boredom to contri~ Giora Simchoni
## 15 A SAS-to-R success story Elizabeth J. Atk~
## 16 Reinforcement learning in Minecraft with CNTK-R Ali Zaidi
## 17 Kaggle in the classroom: using R and GitHub to run p~ Colin Rundel
## 18 Imagine Boston 2030: Using R-Shiny to keep ourselves~ Kayla Patel
## 19 Something old, something new, something borrowed, so~ Chester Ismay
## 20 Training an army of new data scientists Marco BlumeI’m now left with around 20 talks, which is the number I expected. Hooray!
The final step is to get hold of the abstracts.
Getting the URLs of the Abstracts
The only place I could find the abstracts for the talks was on the individual videos, so there’s a final bit of webscraping to do.
Like before, I used read_html() to pull the entire page, and then html_nodes() and html_text() to pull out the text.
video_links <- read_html("https://www.rstudio.com/resources/videos/rstudioconf-2018-talks/")

titles <- video_links %>%
  html_nodes("#post-15671 a") %>%
  html_text()

# Get rid of any blank values
titles <- titles[titles!=""]

head(titles)
## [1] "Greg Swinehart"
## [2] "The unreasonable effectiveness of empathy"
## [3] "Teach the Tidyverse to beginners"
## [4] "How I Learned to Stop Worrying and Love the Firewall"
## [5] "Imagine Boston 2030: Using R-Shiny to keep ourselves accountable and empower the public"
## [6] "Phrasing: communicating data science through tweets, gifs, and classic misdirection"I also need the links to the pages where the talks are. To pull these out, instead of html_text(), I used html_attr() which extracts everything with a specified attribute, in this case, “href” for the link locations.
As there is duplication I only keep every alternating value.
links <- video_links %>%
  html_nodes("#post-15671 a") %>%
  html_attr("href")

links <- links[seq(from = 1, to = length(links), by = 2)]

head(links)
## [1] "https://www.rstudio.com/rviews/author/greg/"
## [2] "https://www.rstudio.com/resources/videos/the-unreasonable-effectiveness-of-empathy/"
## [3] "https://www.rstudio.com/resources/videos/teach-the-tidyverse-to-beginners/"
## [4] "https://www.rstudio.com/resources/videos/how-i-learned-to-stop-worrying-and-love-the-firewall/"
## [5] "https://www.rstudio.com/resources/videos/imagine-boston-2030-using-r-shiny-to-keep-ourselves-accountable-and-empower-the-public/"
## [6] "https://www.rstudio.com/resources/videos/phrasing-communicating-data-science-through-tweets-gifs-and-classic-misdirection/"I then grab the presenter names…
names <- video_links %>%
  html_nodes("em") %>%
  html_text()

head(names)
## [1] "JD Long" "David Robinson" "Ian Lyttle" "Kayla Patel"
## [5] "Mara Averick" "Tanya Cashorali"Great! Now I’m ready to combine my titles, links, and names. If we look at the first few elements of names, titles and links, we can see that there is an erroneous extra value in titles and links but not names - I must have accidentally picked this up with my selectors from earlier.
head(names, 3)## [1] "JD Long" "David Robinson" "Ian Lyttle"head(titles, 3)## [1] "Greg Swinehart"
## [2] "The unreasonable effectiveness of empathy"
## [3] "Teach the Tidyverse to beginners"head(links, 3)## [1] "https://www.rstudio.com/rviews/author/greg/"
## [2] "https://www.rstudio.com/resources/videos/the-unreasonable-effectiveness-of-empathy/"
## [3] "https://www.rstudio.com/resources/videos/teach-the-tidyverse-to-beginners/"To get rid of this, I combine names and titles in a data_frame and then slice() this extra row off before adding the name column.
abstract_links <- data_frame(titles, links) %>%
  slice(-1) %>%
  mutate(name = names)

head(abstract_links)
## # A tibble: 6 x 3
## titles links name
## <chr> <chr> <chr>
## 1 The unreasonable effectiveness~ https://www.rstudio.com/resour~ JD Long
## 2 Teach the Tidyverse to beginne~ https://www.rstudio.com/resour~ David R~
## 3 How I Learned to Stop Worrying~ https://www.rstudio.com/resour~ Ian Lyt~
## 4 Imagine Boston 2030: Using R-S~ https://www.rstudio.com/resour~ Kayla P~
## 5 Phrasing: communicating data s~ https://www.rstudio.com/resour~ Mara Av~
## 6 Rapid prototyping data product~ https://www.rstudio.com/resour~ Tanya C~Awesome, I have my table of URLs, talks, and authors. Let’s join that with my table of contributed talks.
left_join(contributed_talks, abstract_links, by = c("authors" = "name"))## # A tibble: 20 x 4
## talks authors titles links
## <chr> <chr> <chr> <chr>
## 1 The future of time ~ Davis Vau~ The future of time~ https://www.rstudi~
## 2 infer: a package fo~ Andrew Br~ infer: a package f~ http://www.rstudio~
## 3 Tidying up your net~ Thomas Li~ Tidying up your ne~ https://www.rstudi~
## 4 The lesser known st~ Emily Rob~ The lesser known s~ https://www.rstudi~
## 5 Creating interactiv~ Carson Si~ Creating interacti~ https://www.rstudi~
## 6 Open-source solutio~ Carl Ganz Open-source soluti~ https://www.rstudi~
## 7 Adaptive feedback f~ Daniel Ka~ Adaptive feedback ~ https://www.rstudi~
## 8 tidycf: Turning ana~ Emily Rie~ tidycf: Turning an~ http://www.rstudio~
## 9 Branding and automa~ Daniel Ha~ Branding and autom~ https://www.rstudi~
## 10 Understanding PCA u~ Julia Sil~ Understanding PCA ~ https://www.rstudi~
## 11 Connecting to open ~ Kirill Mü~ <NA> <NA>
## 12 An assignment opera~ Nathan Te~ An assignment oper~ https://www.rstudi~
## 13 Developing and depl~ Herman So~ Developing and dep~ http://www.rstudio~
## 14 Five packages in fi~ Giora Sim~ Five packages in f~ https://www.rstudi~
## 15 A SAS-to-R success ~ Elizabeth~ A SAS-to-R success~ https://www.rstudi~
## 16 Reinforcement learn~ Ali Zaidi <NA> <NA>
## 17 Kaggle in the class~ Colin Run~ Kaggle in the clas~ https://www.rstudi~
## 18 Imagine Boston 2030~ Kayla Pat~ Imagine Boston 203~ https://www.rstudi~
## 19 Something old, some~ Chester I~ Something old, som~ https://www.rstudi~
## 20 Training an army of~ Marco Blu~ Training an army o~ https://www.rstudi~There are a couple of talks missing URLS and further inspection reveals that this is due to a missing middle name and a missing umlaut, so I make a couple of manual adjustments using case_when() and redo my join.
talks_and_urls <- contributed_talks %>%
mutate(
  authors = case_when(
    authors == "Ali Zaidi" ~ "Ali-Kazim Zaidi",
    authors == "Kirill Müller" ~ "Kirill Muller",
    TRUE ~ authors
  )
) %>%
  left_join(abstract_links, by = c("authors" = "name"))

talks_and_urls
## # A tibble: 20 x 4
## talks authors titles links
## <chr> <chr> <chr> <chr>
## 1 The future of time ~ Davis Vau~ The future of time~ https://www.rstudi~
## 2 infer: a package fo~ Andrew Br~ infer: a package f~ http://www.rstudio~
## 3 Tidying up your net~ Thomas Li~ Tidying up your ne~ https://www.rstudi~
## 4 The lesser known st~ Emily Rob~ The lesser known s~ https://www.rstudi~
## 5 Creating interactiv~ Carson Si~ Creating interacti~ https://www.rstudi~
## 6 Open-source solutio~ Carl Ganz Open-source soluti~ https://www.rstudi~
## 7 Adaptive feedback f~ Daniel Ka~ Adaptive feedback ~ https://www.rstudi~
## 8 tidycf: Turning ana~ Emily Rie~ tidycf: Turning an~ http://www.rstudio~
## 9 Branding and automa~ Daniel Ha~ Branding and autom~ https://www.rstudi~
## 10 Understanding PCA u~ Julia Sil~ Understanding PCA ~ https://www.rstudi~
## 11 Connecting to open ~ Kirill Mu~ Connecting to open~ https://www.rstudi~
## 12 An assignment opera~ Nathan Te~ An assignment oper~ https://www.rstudi~
## 13 Developing and depl~ Herman So~ Developing and dep~ http://www.rstudio~
## 14 Five packages in fi~ Giora Sim~ Five packages in f~ https://www.rstudi~
## 15 A SAS-to-R success ~ Elizabeth~ A SAS-to-R success~ https://www.rstudi~
## 16 Reinforcement learn~ Ali-Kazim~ Reinforcement lear~ https://www.rstudi~
## 17 Kaggle in the class~ Colin Run~ Kaggle in the clas~ https://www.rstudi~
## 18 Imagine Boston 2030~ Kayla Pat~ Imagine Boston 203~ https://www.rstudi~
## 19 Something old, some~ Chester I~ Something old, som~ https://www.rstudi~
## 20 Training an army of~ Marco Blu~ Training an army o~ https://www.rstudi~And it’s worked! But what I want is the actual abstract text, which is what I’ll be doing in the next section.
Scraping the Abstracts
In order to scrape the abstracts from the table of talks and URLs, I need to:
- Read each URL
- Use the relevant selector to pull out just the abstract text nodes
- Use
html_text()to pull just the text out of each node.
I’ve done this a few times already, so it should be simple case of chucking this all into an lapply(), right? Well, not quite…
abstracts <- lapply(talks_and_urls$links, function(i){
  read_html(i) %>%
  html_nodes(".2_3 p") %>%
  html_text()
})
## Error in parse_simple_selector(stream): Expected selector, got <NUMBER '.2' at 1>I quickly get an error. I’m not sure of the source of this, but a remedy here is to use XPath instead of CSS (easily acquired from Selector Gadget) to specify the components I want:
abstracts <- lapply(talks_and_urls$links, function(i){
  read_html(i) %>%
  html_nodes(xpath='//*[contains(concat( " ", @class, " " ), concat( " ", "2_3", " " ))]//p') %>%
  html_text()
})

tail(abstracts, 3)
## [[1]]
## [1] "The Imagine Boston 2030 plan was released in July 2017 as the City of Boston’s first long-term plan in 50 years. After hearing from more than 15,000 residents, five major goals were outlined in the plan – (1) encourage affordability, reduce displacement, and improve quality of life, (2) increase access to opportunity, (3) drive inclusive economic growth, (4) promote a healthy environment and prepare for climate change, and (5) invest in open space, arts & culture, transportation, and infrastructure – each of which are tracked through a series of different metrics. Using R-Shiny, we developed a public-facing dashboard (https://analytics.boston.gov/app/imagine-boston) that interactively displays data associated with each of the goals and metrics allowing users to quickly gain an understanding of how close we are to achieving the goals laid out in the plan. By publicly displaying the data, the dashboard helps the City keep itself accountable and empowers the public to make sure we’re actively working towards creating the Boston they want to see."
## [2] "The code behind the dashboard has gone through a series of revisions and in the process has gone from being a few large files to modularized and reusable. In addition to showcasing the dashboard, this talk will tell the story of why the dashboard was built using R-Shiny and how we took our code from something that “just works” to developing reusable components that are being implemented in other dashboards the City is creating."
##
## [[2]]
## [1] "How can we effectively but gently launch new students into the world of data science? In this talk, I will discuss the ways that Albert Y. Kim and I have gone about approaching this by creating an open source, fully reproducible textbook using the bookdown package at ModernDive.com. The textbook uses the paradigm of books as versions instead of editions featuring an introductory “getting started” chapter with links to many videos and interactive content available on DataCamp.com to support new R users. I’ll also discuss how we used #chalktalk (instead of slides) to slow down our instruction to help beginners grasp tidyverse and coding concepts. I will take a glimpse into the new infer package for statistical inference, which performs statistical inference using an expressive syntax that follows tidy design principles. Lastly, I’ll demonstrate vignettes and R Markdown reports that our students created to further support the emerging tidyverse community ecosystem and I’ll provide future goals for our ModernDive.com project."
##
## [[3]]
## [1] "Sports Betting markets are one of the purest prediction markets that exist and are yet vastly misunderstood by the public. Unlike most others markets, such as finance, sports can be measured in the physical world and thus a vast array of statistical data exists. Since the late 90s, Pinnacle has been one of the largest sportsbooks in the world and also one of the only sportsbooks who will take wagers from professional bettors (who we expect to lose to). At Pinnacle our focus is on modeling, automation, data science and R is a central piece of our business. We are constantly trying to innovate and make the best use out of our large volumes of data."
## [2] "In the last few years, we have undertaken the monumental task of training our 400+ employee workforce to better understand data and how to use data to drive all business decisions, whether it be prediction markets, customer service, marketing, payment solutions, etc. Many of these employees previously had no background in Data Science or had ever written a line of code. On this journey, We have recorded data on where students commonly fail or get frustrated and tried to weigh that with the skills we know are needed to solve real business problems. We have since come up with a well-defined set of curriculum using pieces from Data Camp, along with the custom curriculum. With this has come a focus on tidyverse, specifically mastering dplyr, and cutting out some of the core materials, such as working with matrices. Along the way, we have learned many lessons and have many success stories to share, such as former secretaries or customer service reps being retrained and promoted Data Scientists, who now work every day on using our data to make smarter business decisions. We would like to tell our story so that the community can learn from our mistakes and successes."This takes a while as there are a lof of asbtracts to pull, but once it’s done, it’s looking good. This object is a list, each element containing a character vector of length 1 or more for each abstract. I want to make sure they’re all only 1 item long, so use vapply() to paste() the contents of each abstract into a single character object.
abstracts <- vapply(abstracts, function(abstract){
  paste(abstract, collapse = "  ")
}, character(1))
Finally, I append the abstracts column onto my talks_and_urls table. I’ve not displayed it here, as the result is huge on the page.
talks_and_urls$abstracts = abstractsSo here we have it, the full list of abstracts. I’m not 100% sure it’s accurate, as this post on the RStudio blog suggests different numbers of people for each status. My best guess is that couple of people I have down as delivering “contributed” talks were actually invited speakers who were invited after the publication of this blog post.